Turn ambition into a credible decarbonisation pathway

A planning platform for modelling decarbonisation initiatives, testing them across scenarios and reporting the results — so the route to target rests on evidence, not assumptions.

Access by invitation only
Results

Dashboard

Base year footprint · 2023
128,400tCO₂e
Abatement at 2030
−46,900tCO₂e
Gap to target
8,150tCO₂e
Active initiatives
14

Emissions pathway

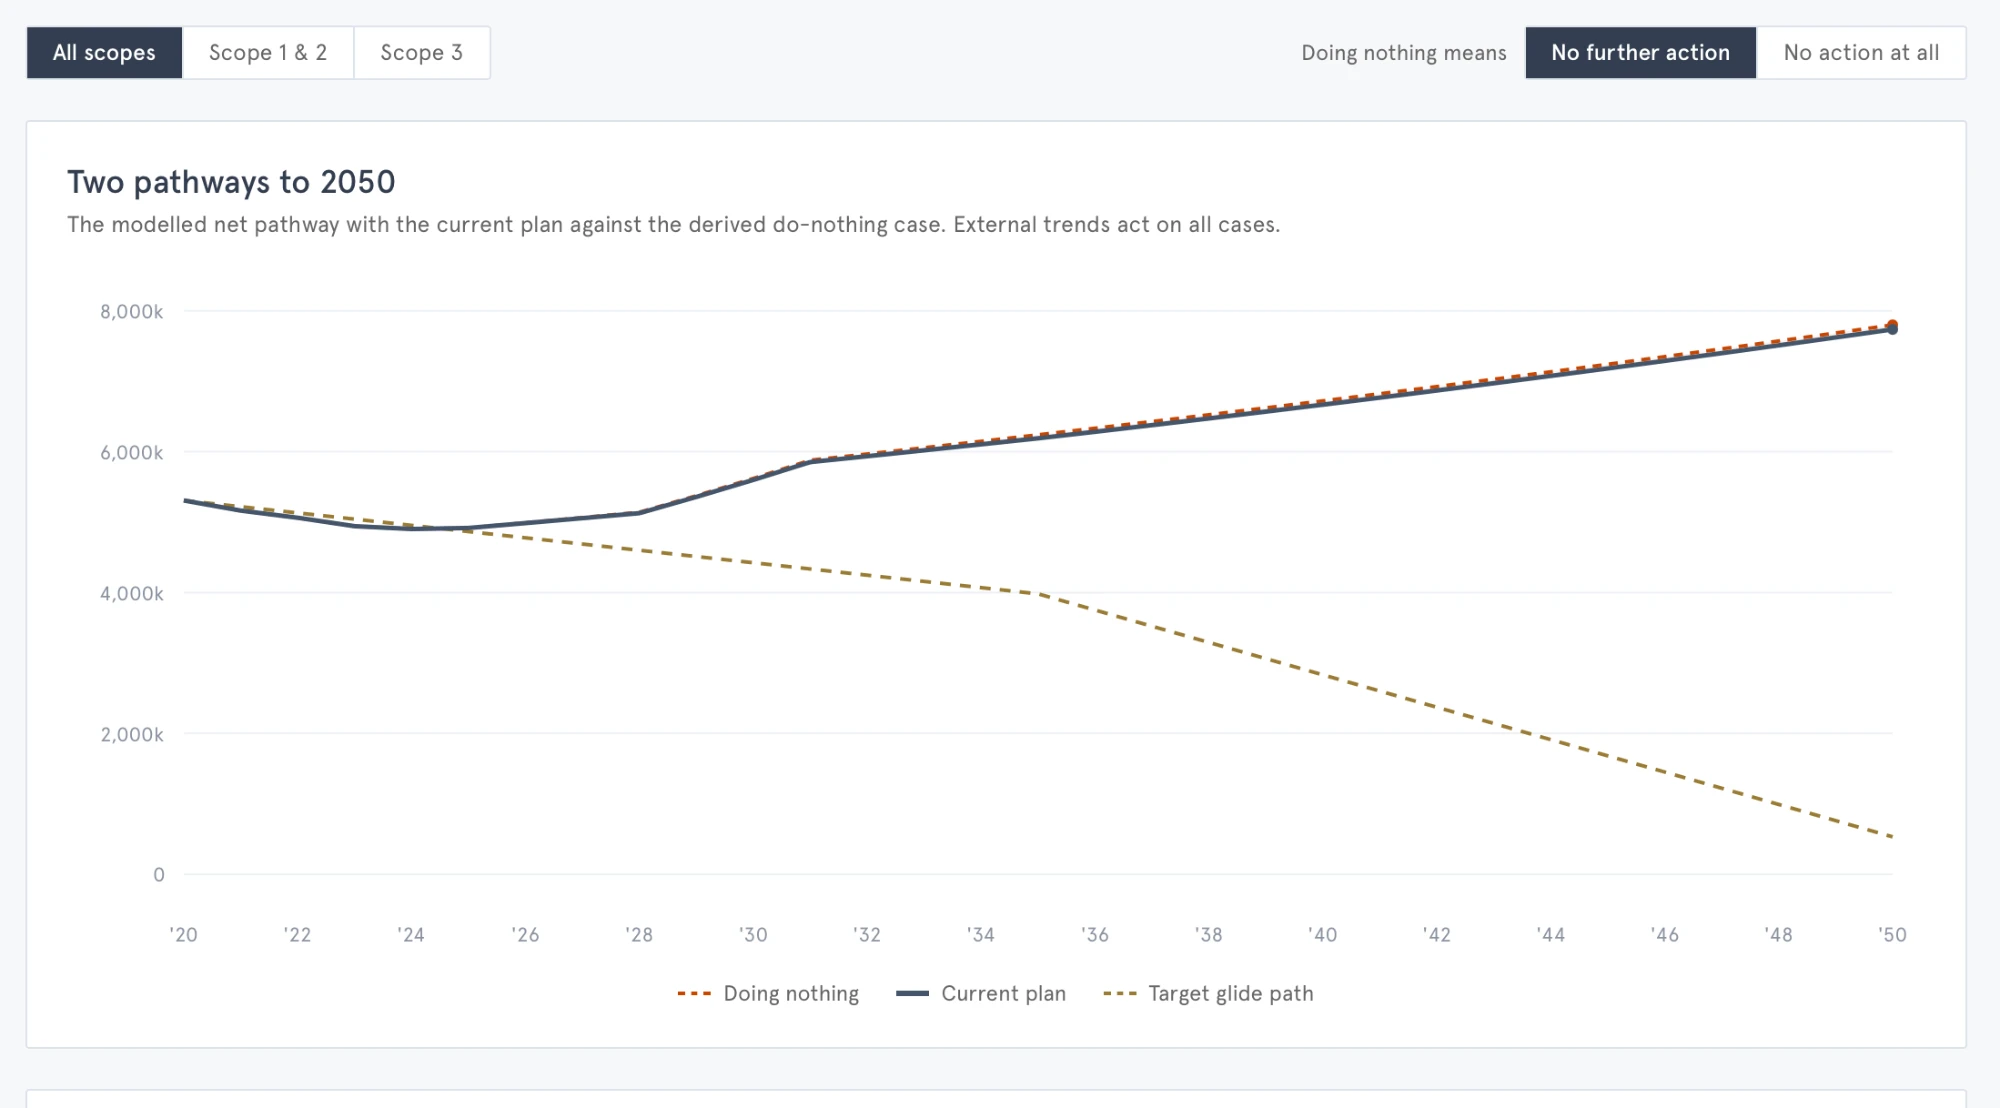
Business as usual vs the planned pathway, against target · tCO₂e
160k120k 80k40k0 20232025 202720292030

From baseline to plan

Waterfall at 2030, by category · tCO₂e
BaselineEnergy FleetSupplyPlan
The dashboard — one live model behind every view. Shown with illustrative data.

What it does

Model, test and report a decarbonisation plan in one place

From the first initiative to a board-ready report, the work stays in a single connected model — so reports are generated straight from the live data, not rebuilt slide by slide.

Initiatives

A portfolio built initiative by initiative

Each initiative carries its own cost, emissions impact, growth profile and owner. The calculation engine keeps abatement, cost per tonne and delivery status live as the model changes.

  • Scope 1, 2 and 3 coverage per initiative
  • Cost per tonne calculated from the live model
  • Owners and delivery status alongside the numbers

Initiatives

Ranked by abatement at 2030 · illustrative data
All 14 initiatives ⟶
InitiativeScope Abatement at 2030Cost / tonneStatus
Supplier engagement programmeS3 11,400 t€22At risk
Fleet electrificationS1 6,200 t€38On track
Solar PV rolloutS2 4,850 t−€12On track
Rail freight shiftS3 3,750 t€18On track
Heat pump conversionS1 2,300 t€54Planned

Scenarios

Test the plan before committing to it

Run several named scenarios per engagement — clone, snapshot and compare them side by side to see which pathway closes the gap most effectively, and what happens if delivery slips.

  • Clone a scenario and change one assumption at a time
  • Snapshots preserve versions worth keeping
  • The gap to target recalculates as scenarios change

Scenario comparison

Net emissions at 2030 against target · illustrative data
Committed measures
Funded initiatives only
96,300tCO₂e
14,800 t short
Full portfolio
All 14 initiatives delivered
81,500tCO₂e
Meets target
Delayed delivery
Key initiatives slip 2 years
103,900tCO₂e
22,400 t short

Reporting

Reports generated from the live model

Export polished one-pagers, full presentations and data workbooks straight from the same data the model runs on — with no manual rebuilding between the model and the slide.

  • Executive summaries and full transition-plan decks
  • One-pagers per initiative for owners and steering groups
  • Every change recorded in an append-only audit log

Reports

Generated from the current model state
Executive summary
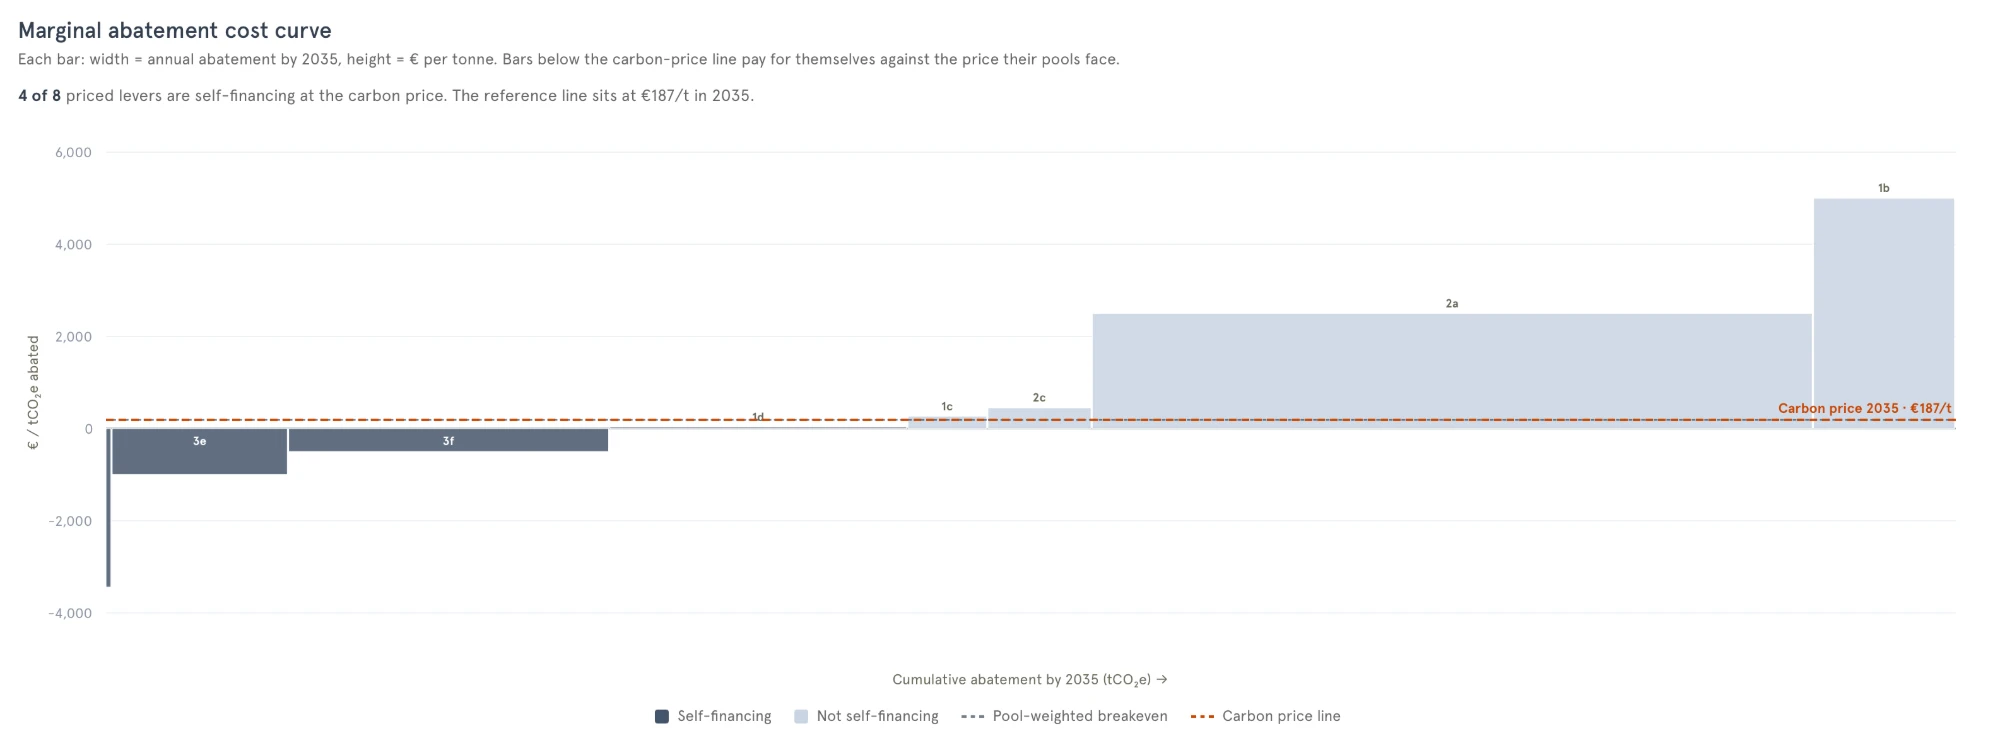
Board-ready deck — pathway, waterfall and cost curve
PPTX
Transition plan
The full plan — targets, initiatives, scenarios and delivery
PPTX
Initiative one-pagers
One page per initiative, for owners and steering groups
PDF
Full data workbook
Every figure behind the plan, sheet by sheet
XLSX

How it works

From a blank model to a board-ready plan

01

Model the portfolio

Capture each initiative with its cost, emissions impact, growth profile and owner. The calculation engine keeps the totals live as the model changes.

02

Test against targets

Run scenarios side by side and see the gap to target open or close in real time. Snapshot the versions worth keeping for comparison.

03

Report with confidence

Export one-pagers and full presentations from the same data the model runs on — and review every change to the model in an append-only audit log.

Built by Nordic Sustainability

Tomorrow's leaders transform today.

We are sustainability experts first, consultants second. This platform turns that expertise into a working tool — one companies can use to plan, test and defend their decarbonisation decisions with the evidence to back them.

Getting access

Access is by invitation. Nordic Sustainability provisions the platform for client engagements and the teams working within them.